A Noble Energy Plan

Interactive Brokers’ Trader's Insight
By Gary Christie
This week, using Trading Central’s Technical Event® screener, I searched for U.S. stocks that have listed options, classic technical patterns with a possible price move of 15% or more. One name caught my attention as the stock remains in a well-defined uptrend since March.
Noble Energy (NE): Just recently broke above an ascending continuation triangle pattern. The increasingly higher lows and constant highs within this pattern tell us that buyers are more aggressive than sellers, confirmed by a breakout through a resistance level to signal a continuation of the prior uptrend.
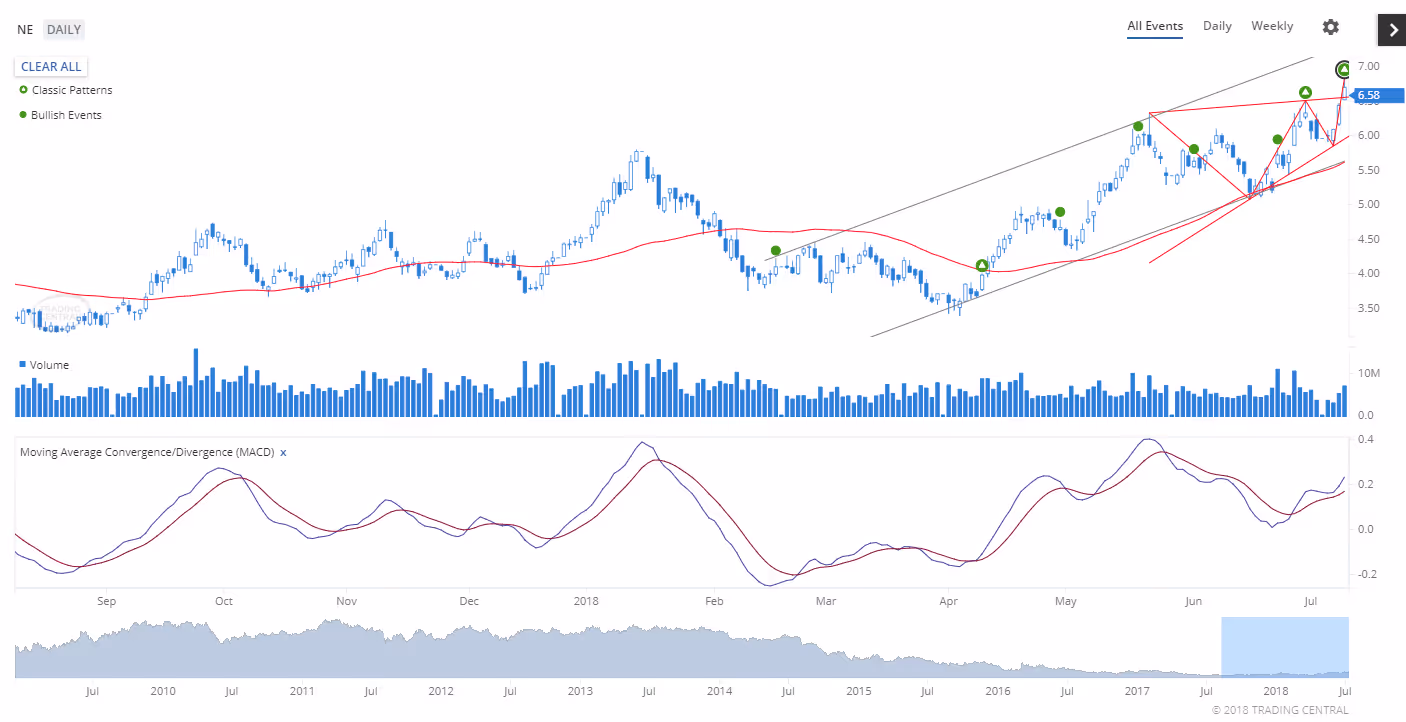
An ascending triangle, with its increasingly higher lows and constant highs, indicates that buyers are more aggressive than sellers. The pattern typically forms because a supply of shares is available at a certain price, represented by the upper flat line. When the supply depletes, the shares quickly break out from the top trend line and move higher.
The MACD (Moving Average Convergence/Divergence) indicator below the price chart has reversed from its neutral level and is showing upside momentum which confirms the bullish breakout.
To read the original Traders’ Insight, visit:
Want to Partner With Us?
Related Articles

Canadian dividend stocks that stand out when viewed through quantamental lens
.avif)
Value Focused Quant Strategy surfaces top Canadian stocks
