

Nasdaq 100 : Bullish Reversal from a "Bear Market" ?
Let's have a Longer-term view, and watch Bullish Reversal signals flashed by MACD and RSI.
Nasdaq 100 Index - Weekly Chart
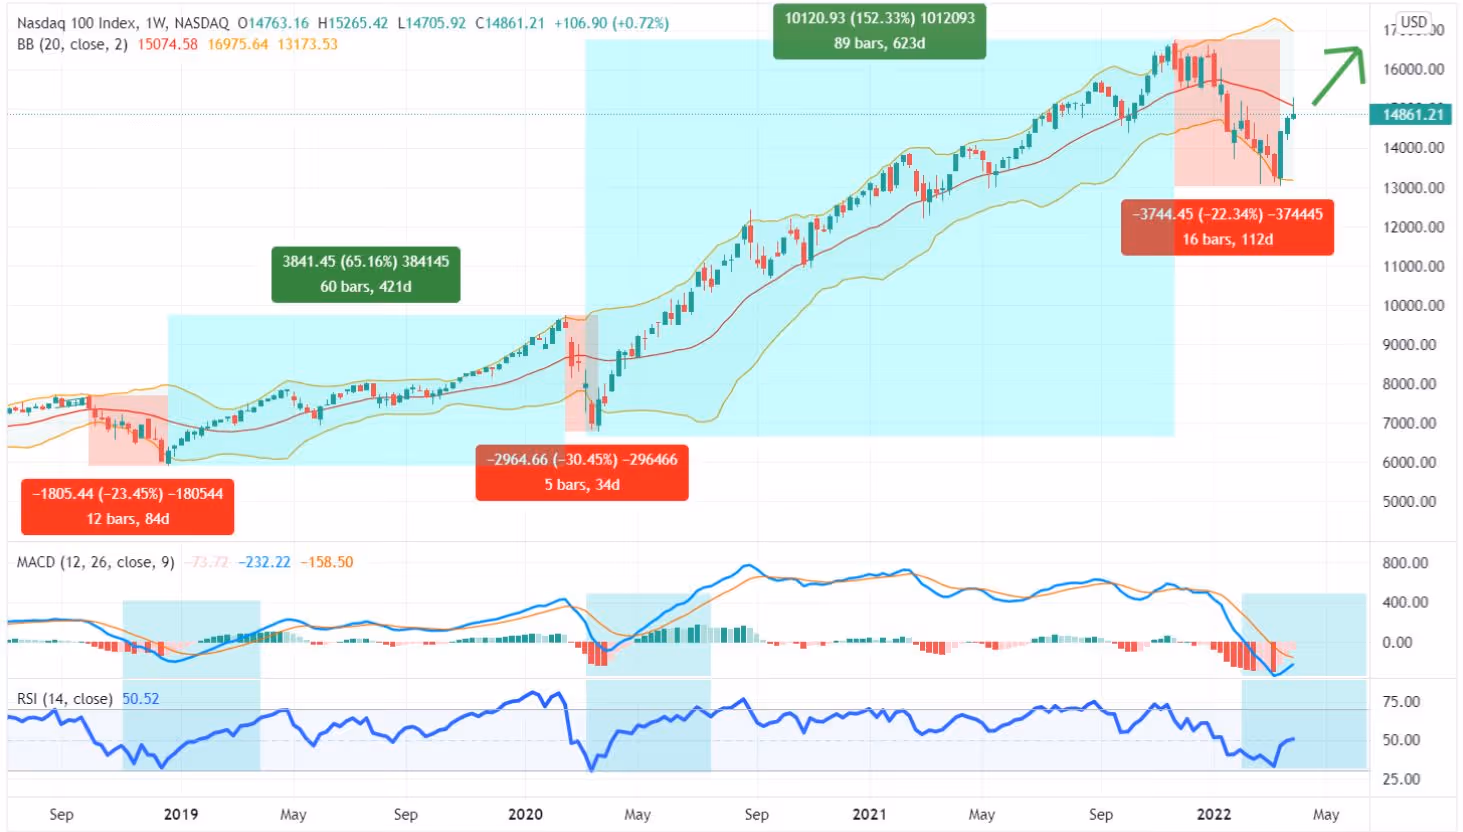
The tech-heavy Nasdaq 100 Index has rebounded for three consecutive weeks following a 22% decline from its November high.
In theory, people call for an index's "Bear Market" once spotting a 20% drop from its recent high.
Now it seems Nasdaq 100's "Bear Market" refuses to develop.
And a long-term Bullish Reversal is in sight -- Note the swinging of Weekly Momentum Oscillators MACD and RSI from lows.
A Weekly Chart shows two previous examples of Nasdaq 100's Bullish Reversal from a "Bear Market" in the past three years:
1) Christmas 2018 (rising 65% rise from bottom);
2) Covid Downturn in March 2020 (rising 152% from the bottom).
Be prepared for the current Bullish Reversal continuing.
Want to Partner With Us?
Related Articles

Canadian dividend stocks that stand out when viewed through quantamental lens
.avif)
Value Focused Quant Strategy surfaces top Canadian stocks
