Value Unleashed: Analyzing Top-Performing Investment Picks

.avif)
In this week’s fundamental report, we look at stocks that offer deep value and outperformance relative to the S&P 500. Utilizing TC’s Strategy Builder along with the Fundamental Insight tools, our selection criteria began by focusing on stocks with a TC Quantamental Rating (TCQR) over 55, suggesting robust fundamentals compared to other entities within the same industry segment. Furthermore, we sought companies with a TC Value Factor exceeding 80, indicating these firms display desirable valuation metrics and ratios relative to their industry peers.
To further refine our pool of potential investments, we set a threshold for the price-to-earnings ratio (P/E) (ttm) at 20 or lower, which is considerably below the present S&P 500 P/E (ttm) average of around 25. Our search criteria also emphasized the importance of strong financial performance, selecting stocks demonstrating both cash flow growth (last quarter versus the previous year) and a five-year historical EPS growth exceeding 10%.

INMD:US
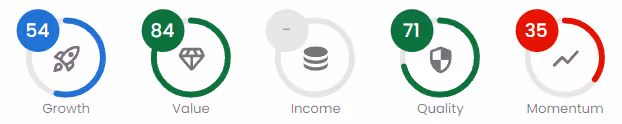
Topping our screener, InMode is a 1.46 billion dollar surgical aesthetic and medical treatment provider boasting a TCQR of 65, the highest in our list, as well as an impressive Value Factor score of 84. Its EPS growth over the past 5 years has also been the best at a whopping 45.74%.
PLAB:US
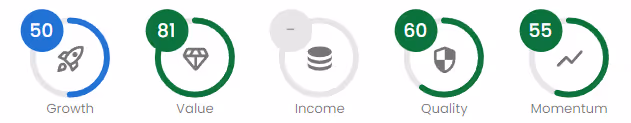
Photronics, a small cap semiconductor entity, has a TCQR of 63 and cash flow growth in the last quarter of 56.98% year over year. Its current Value Factor rating sits at 81.
OSUR:US
OraSure Technologies has the second highest Value Factor score in our 7-stock list, at 93, while exhibiting the lowest TCQR at 60. Its 5-year historical EPS growth is 16.89% while CF growth was 245.81% on year in the previous quarter.

SBOW:US
SilverBow Resources, an independent oil and gas company, with a TCQR of 62 and a Value Factor rating of 82. Its cash flow in the last quarter showcased a 1,002.15% growth year over year.

Trading Central Strategy Builder provides a back-testing capability to evaluate how well an investing strategy would have worked in the past. Using a five-year historical period with quarterly rebalancing, the screen described had a 20 percent annualized return compared with 11 percent for the S&P 500 index.
Want to Partner With Us?
Related Articles

Canadian dividend stocks that stand out when viewed through quantamental lens
.avif)
Value Focused Quant Strategy surfaces top Canadian stocks
