S&P 500: Quantitative and Volatility data suggest it’s not the top


While earnings seasons just started and uncertainty remains high, investors might look for second level risk measures such as the implied volatility and quantitative data.
In terms of implied volatility, a good measure and reference is definitively the VIX. The CBOE describe the VIX Index as a calculation designed to produce a measure of constant, 30-day expected volatility of the U.S. stock market, derived from real-time, mid-quote prices of S&P 500® Index call and put options. On a global basis, it is one of the most recognized measures of volatility -- widely reported by financial media and closely followed by a variety of market participants as a daily market indicator.
From a chartist point of view, the VIX is currently challenging June bottom and is approaching the pre-Covid-19 area. Also, the index is capped by a key declining trend line and confirmed its bearish trend after breaking below its 200-day moving average for the first time since mid-February.
In addition, the percentage of the S&P 500 stocks member trading above their 20-day moving average is currently at 88%; a high level but not overbought yet. Indeed, this measure is pointing for a top when staying above the 90% region for few days and only after it’s exist this 90% area, can a market consolidation happen. To say it in another way, this measure is not yet providing a bearish signal.
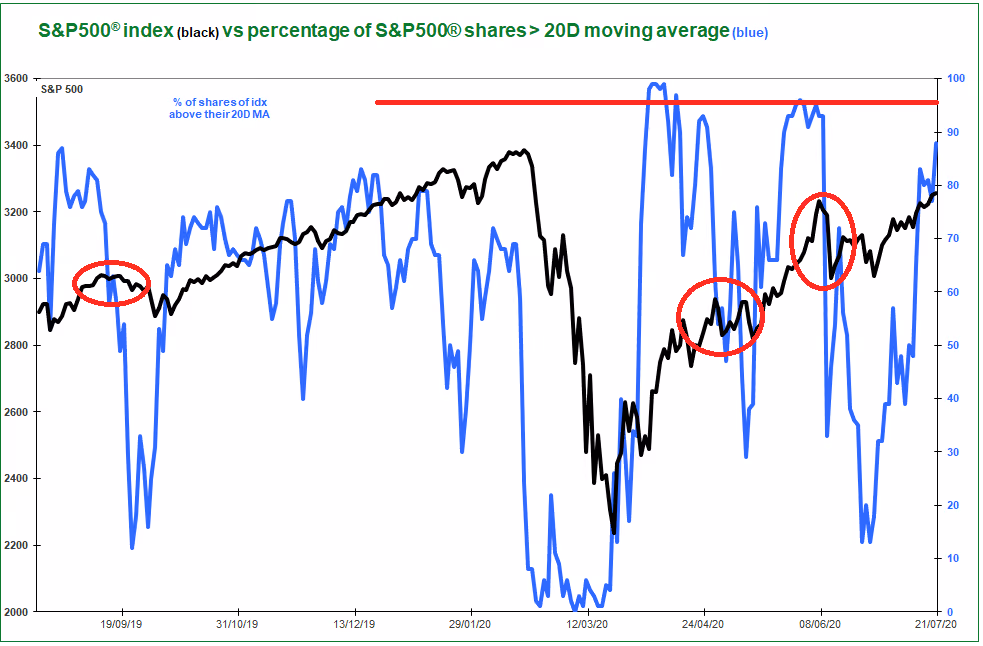
As a consequence, further advance can be expected on the S&P 500 and traders may consider long position above 3110 to target 2020 top at 3390 and even the Fibonacci projection at 3620. Alternatively, below 3110, look for a correction towards 2965.
Rémy Gaussens is the Head of Global Research at Trading Central in Paris.
Want to Partner With Us?
Related Articles
Canadian dividend stocks that stand out when viewed through quantamental lens
.avif)
Value Focused Quant Strategy surfaces top Canadian stocks
