
Using Trading Central's Market Buzz for understanding stocks' variation, Analog Devices (ADI) has been identified as an interesting choice.
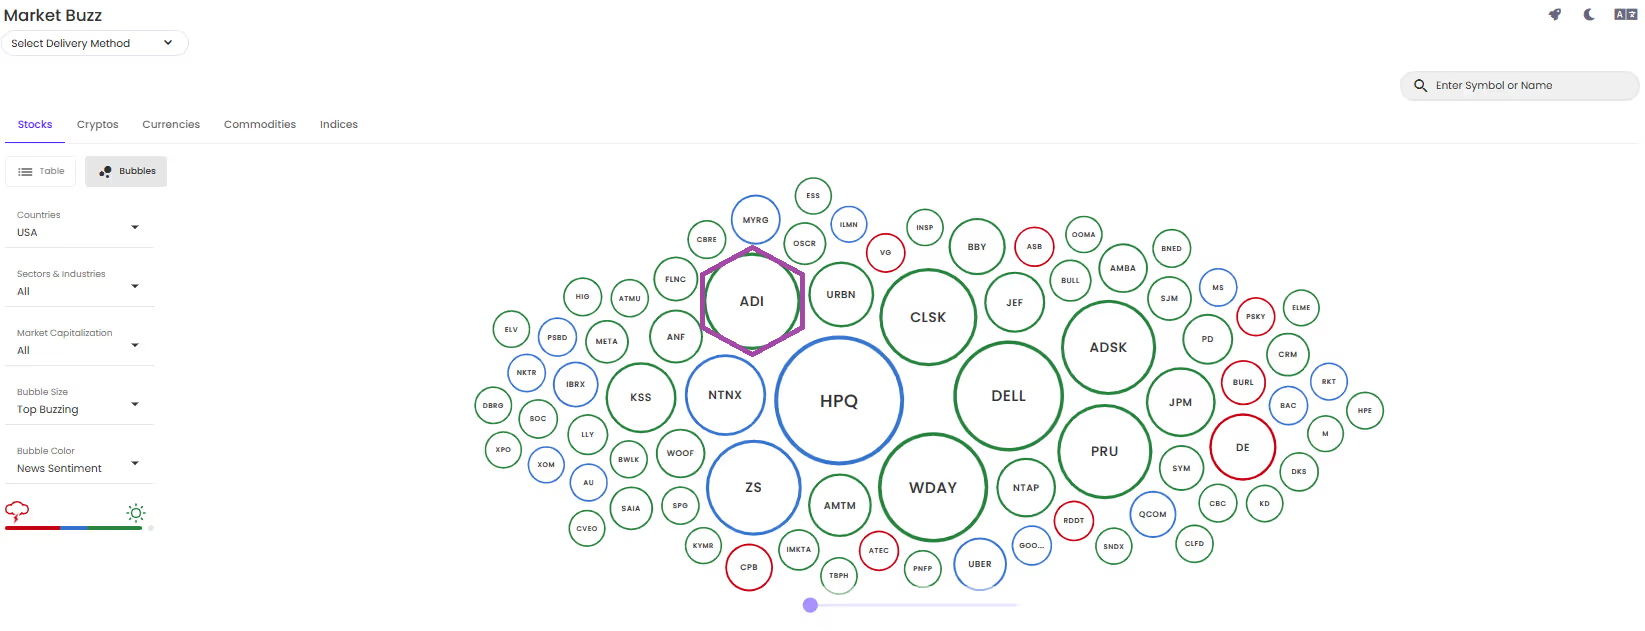
TC Market Buzz has identified Buzzing news volume over the last 24 hours,with 94 mentions. Overall mentions represent the number of publications in the past 24 hours that mention the subject, along with a descriptor indicating how it compares to the 7-day average.


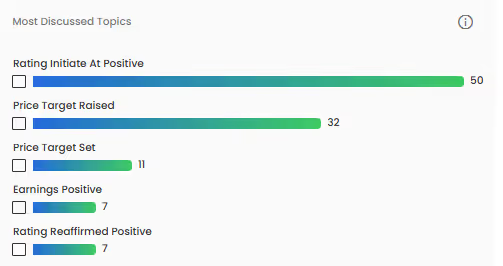
Into Most Discussed Topics widget, we find "Earnings Positive" as Analog Devices released its fourth-quarter results yesterday morning. Thus, the company reported strong Q4 and full-year 2025 financial results, highlighting solid growth across all end markets, with particularly notable gains in the Communications and Industrial segments. The company posted $11 billion in revenue for fiscal 2025, representing a 17% increase from the prior year. Key metrics from the quarter include a 26% year-over-year rise in revenue to $3.08 billion and an expansion of gross margin to 63.1%. Operating income climbed 66% compared to last year, while diluted earnings per share increased by 67%. The company also delivered strong cash performance, generating $4.8 billion in operating cash flow and $4.3 billion in free cash flow, returning 96% of that free cash flow to shareholders through dividends and share buybacks. Following this solid report, several financial institutions such as Bernstein & Morgan Stanley raised their target price or maintained their positive rating. Once again, our "Most Discussed Topics" widget collects this information in second and fifth place.
On the sentiment side, the orientation of the news headlines, analysed by our proprietary Large Language Model, is signaling a bullish sentiment score of 80. The Sentiment Score indicates how the crowd feels about a financial instrument, ranging from "negative" to "positive". Please note that a grade above 55 is a buy signal.

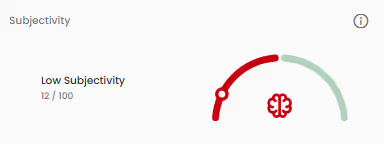
Meanwhile, the subjectivity widget is considered as "Very Low". The subjectivity index measures how rational the crowd's opinion of an entity is, which can be helpful in identifying market bubbles. Its score ranges from 0 (very rational) to 100 (very irrational).
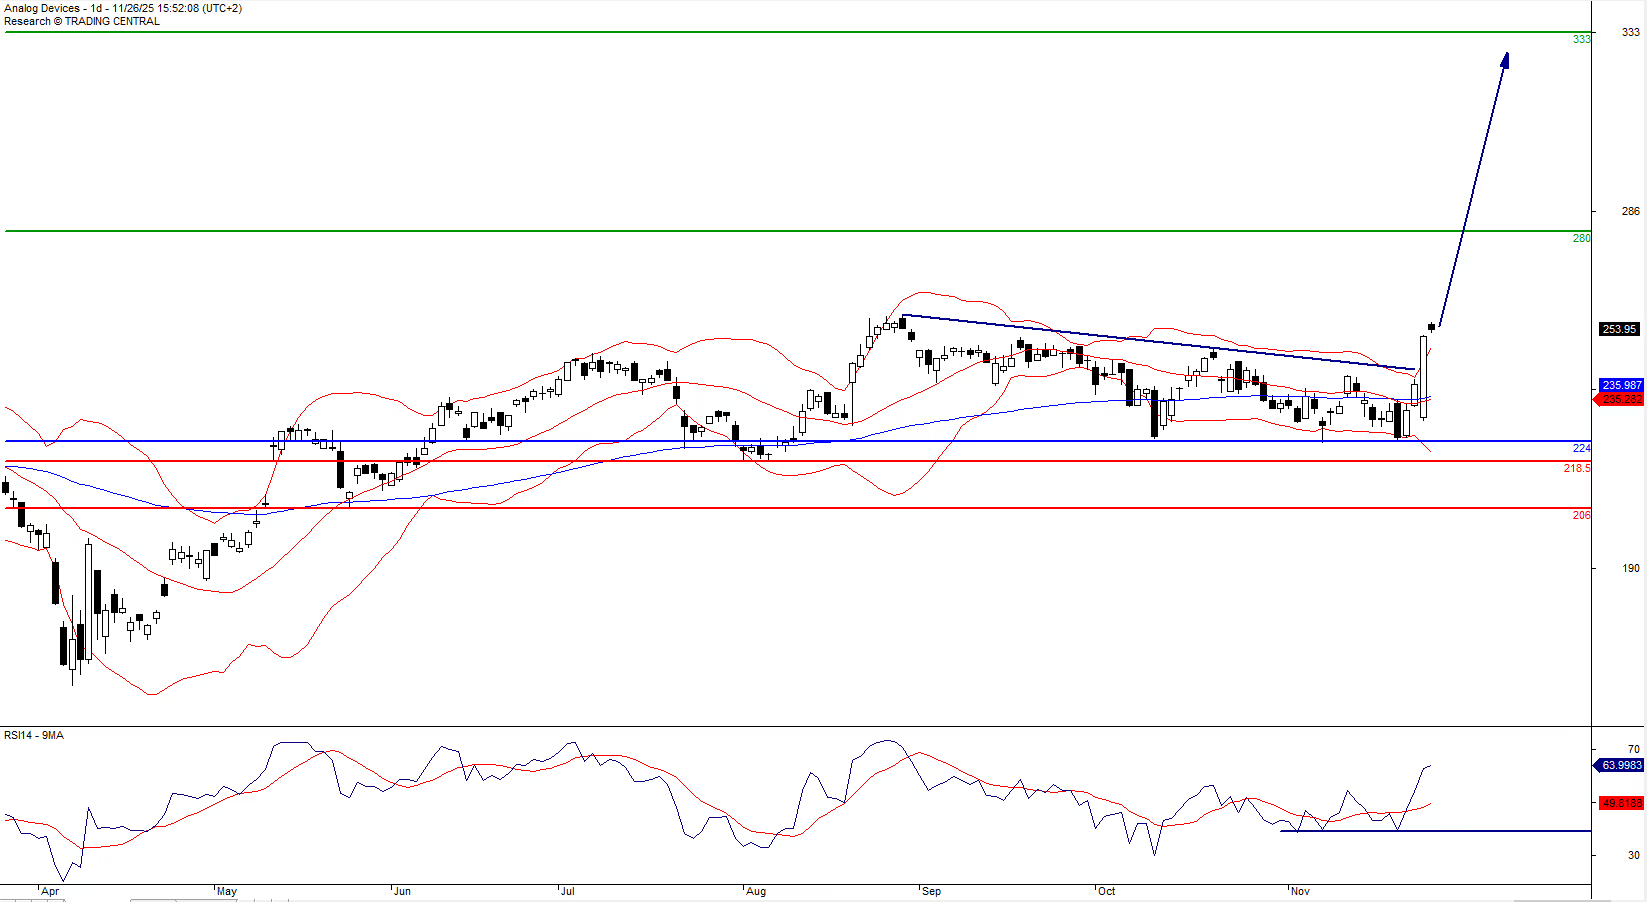
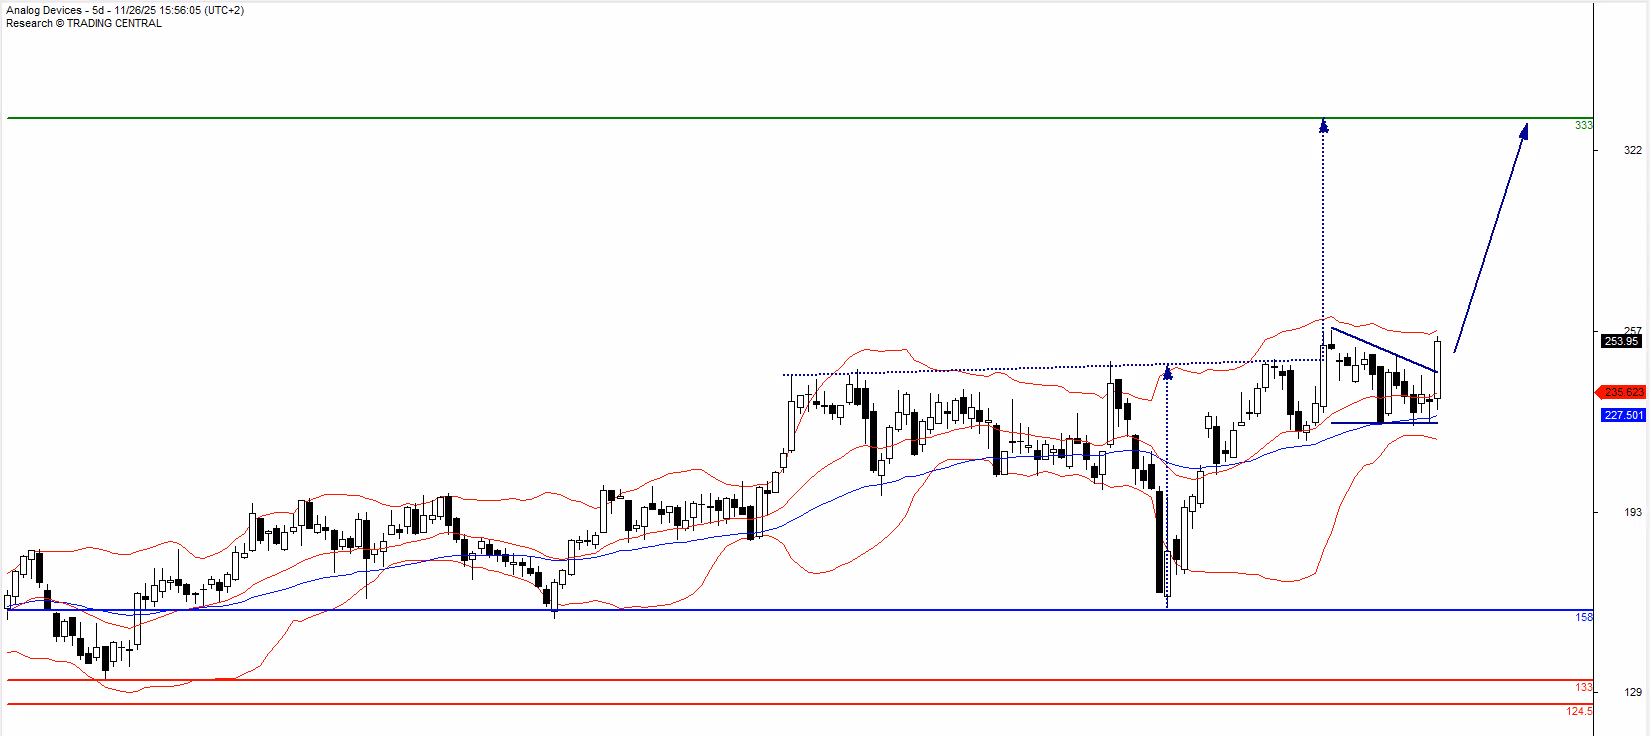
Regarding technical analysis, from a daily perspective, prices have pushed above the upper end of a descending triangle on strong volumes. The confirmation of this bullish continuation pattern should lead the stock towards $280 at least. Please note the RSI indicator is supported by a horizontal support set around 40%. Furthermore, on a weekly chart, the cycle has been positive since the end of August and the upward breakout of an ascending resistance line begun in May 2024. Final target set at $333.
Powered by TC Labs, TC Market Buzz helps investors read less and know more,solving today’s infobesity problem. With an interactive and modern design, Buzz shows investors which stocks and topics are "buzzing", delivering a smarter news experience.
Disclaimer
The views expressed on this blog are my own and do not necessarily reflect the views of my employer.


.png)
.png)
.png)
