Is the bear market over or just beginning?


A couple of interesting charts in the S&P 500 index and Gold help us tell a story and set us up with a trading plan.
The S&P 500 closed up an impressive 10.40% last week which marked the largest weekly gain since 1974, lifted by the Automobiles & Components (+29.11%), Real Estate (+20.3%) and Banks (+20.02%) sectors. The Nasdaq index remains the best performing index in the U.S. year-to-date. The Invesco QQQ Trust ETF is down approximately -5.53 per cent year-to-date compared to a decline of -13.56 per cent for the SPDR S&P 500 index ETF (SPY) and -16.82 per cent for the SPDR Dow Jones Industrial Average ETF (DIA).
Are we witnessing the shortest bear market in history or is the market getting ready to test the lows? No one knows, we have been preparing for a move in either direction. Here are a few charts to consider.
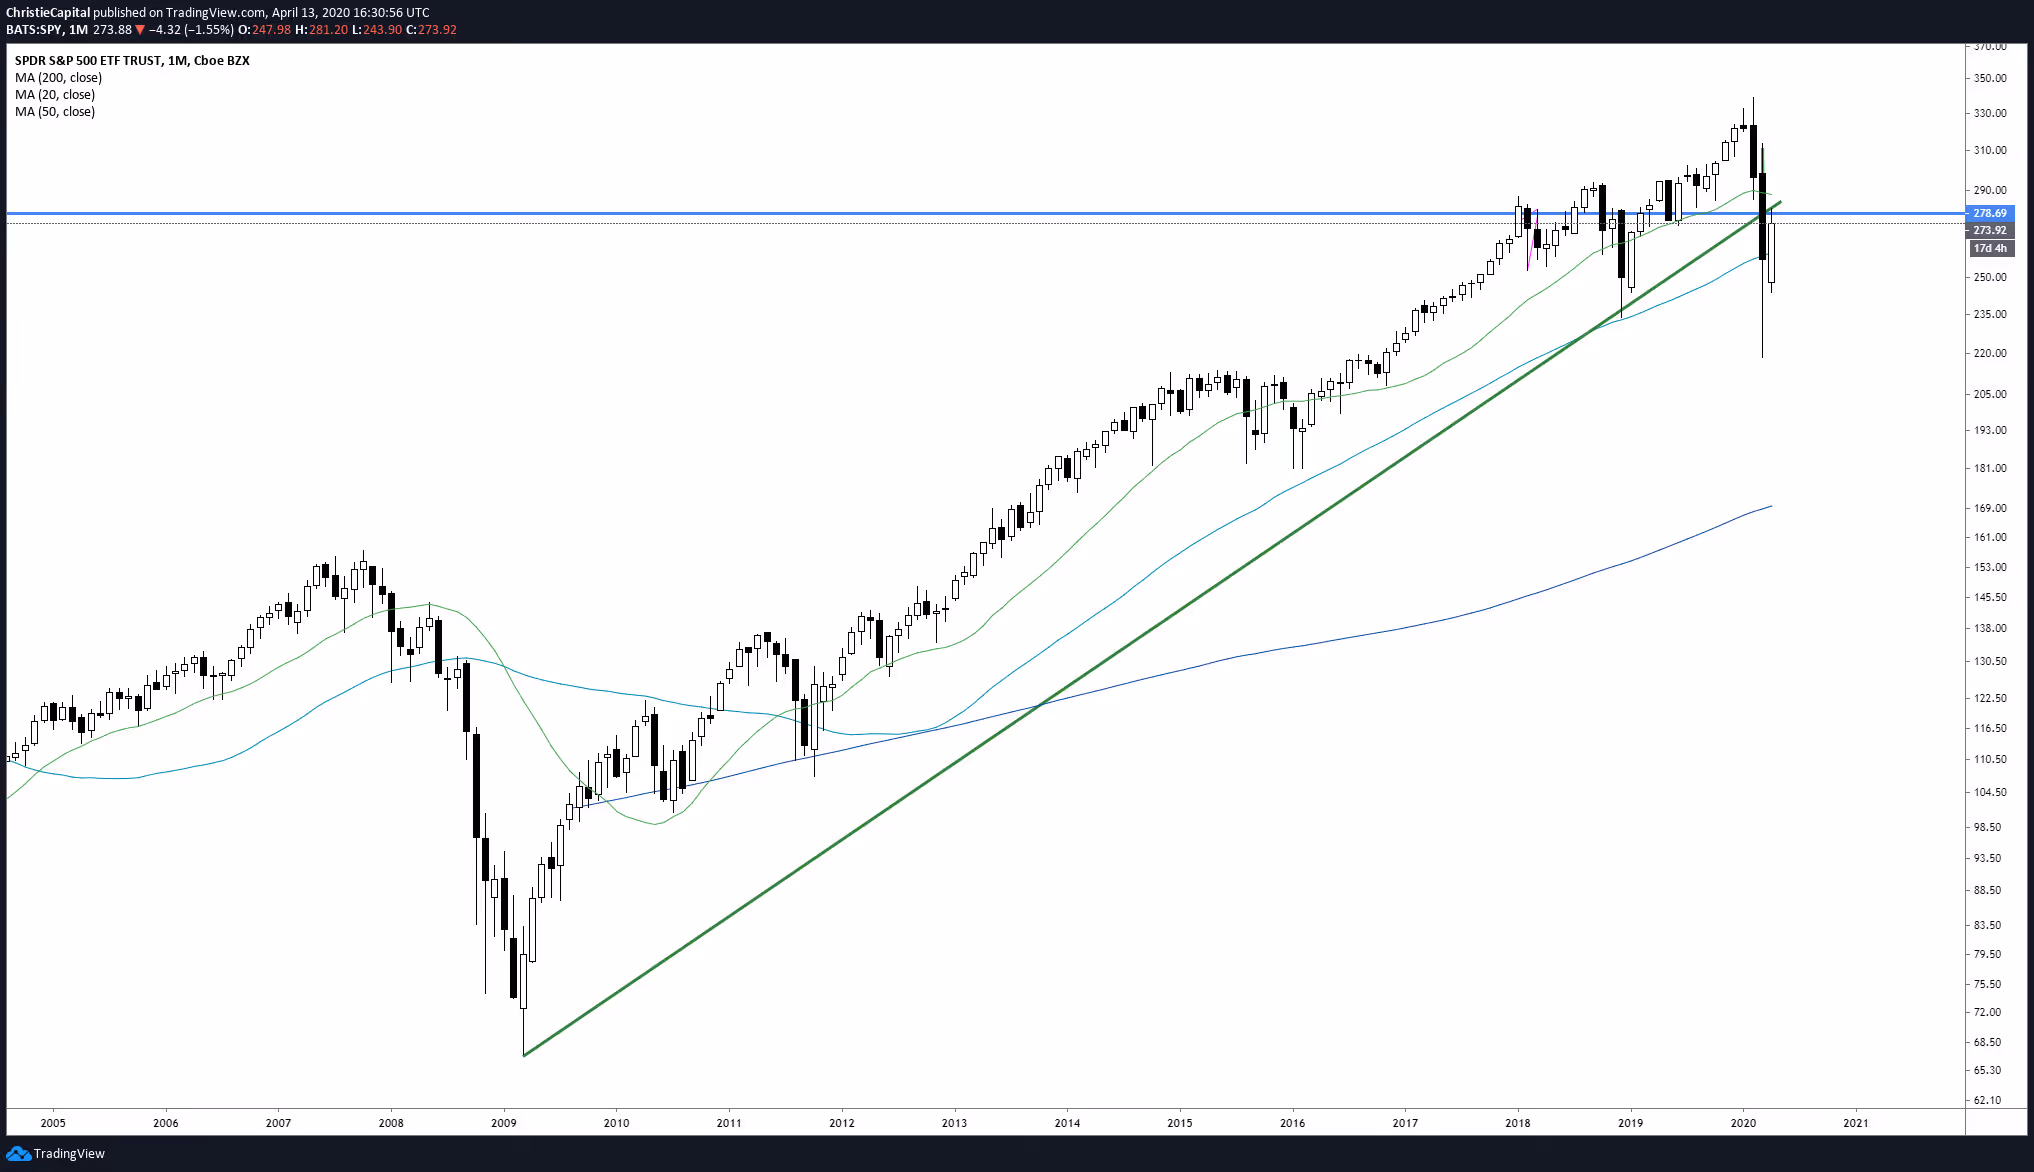
The SPDR S&P 500 (SPY) index ETF has clearly broken its uptrend on a monthly log chart. We are at a tipping point in the index. Can we break back into the uptrend that started in 2009 or is this the beginning of a long term downtrend? For now, price action below trend is a bearish signal.
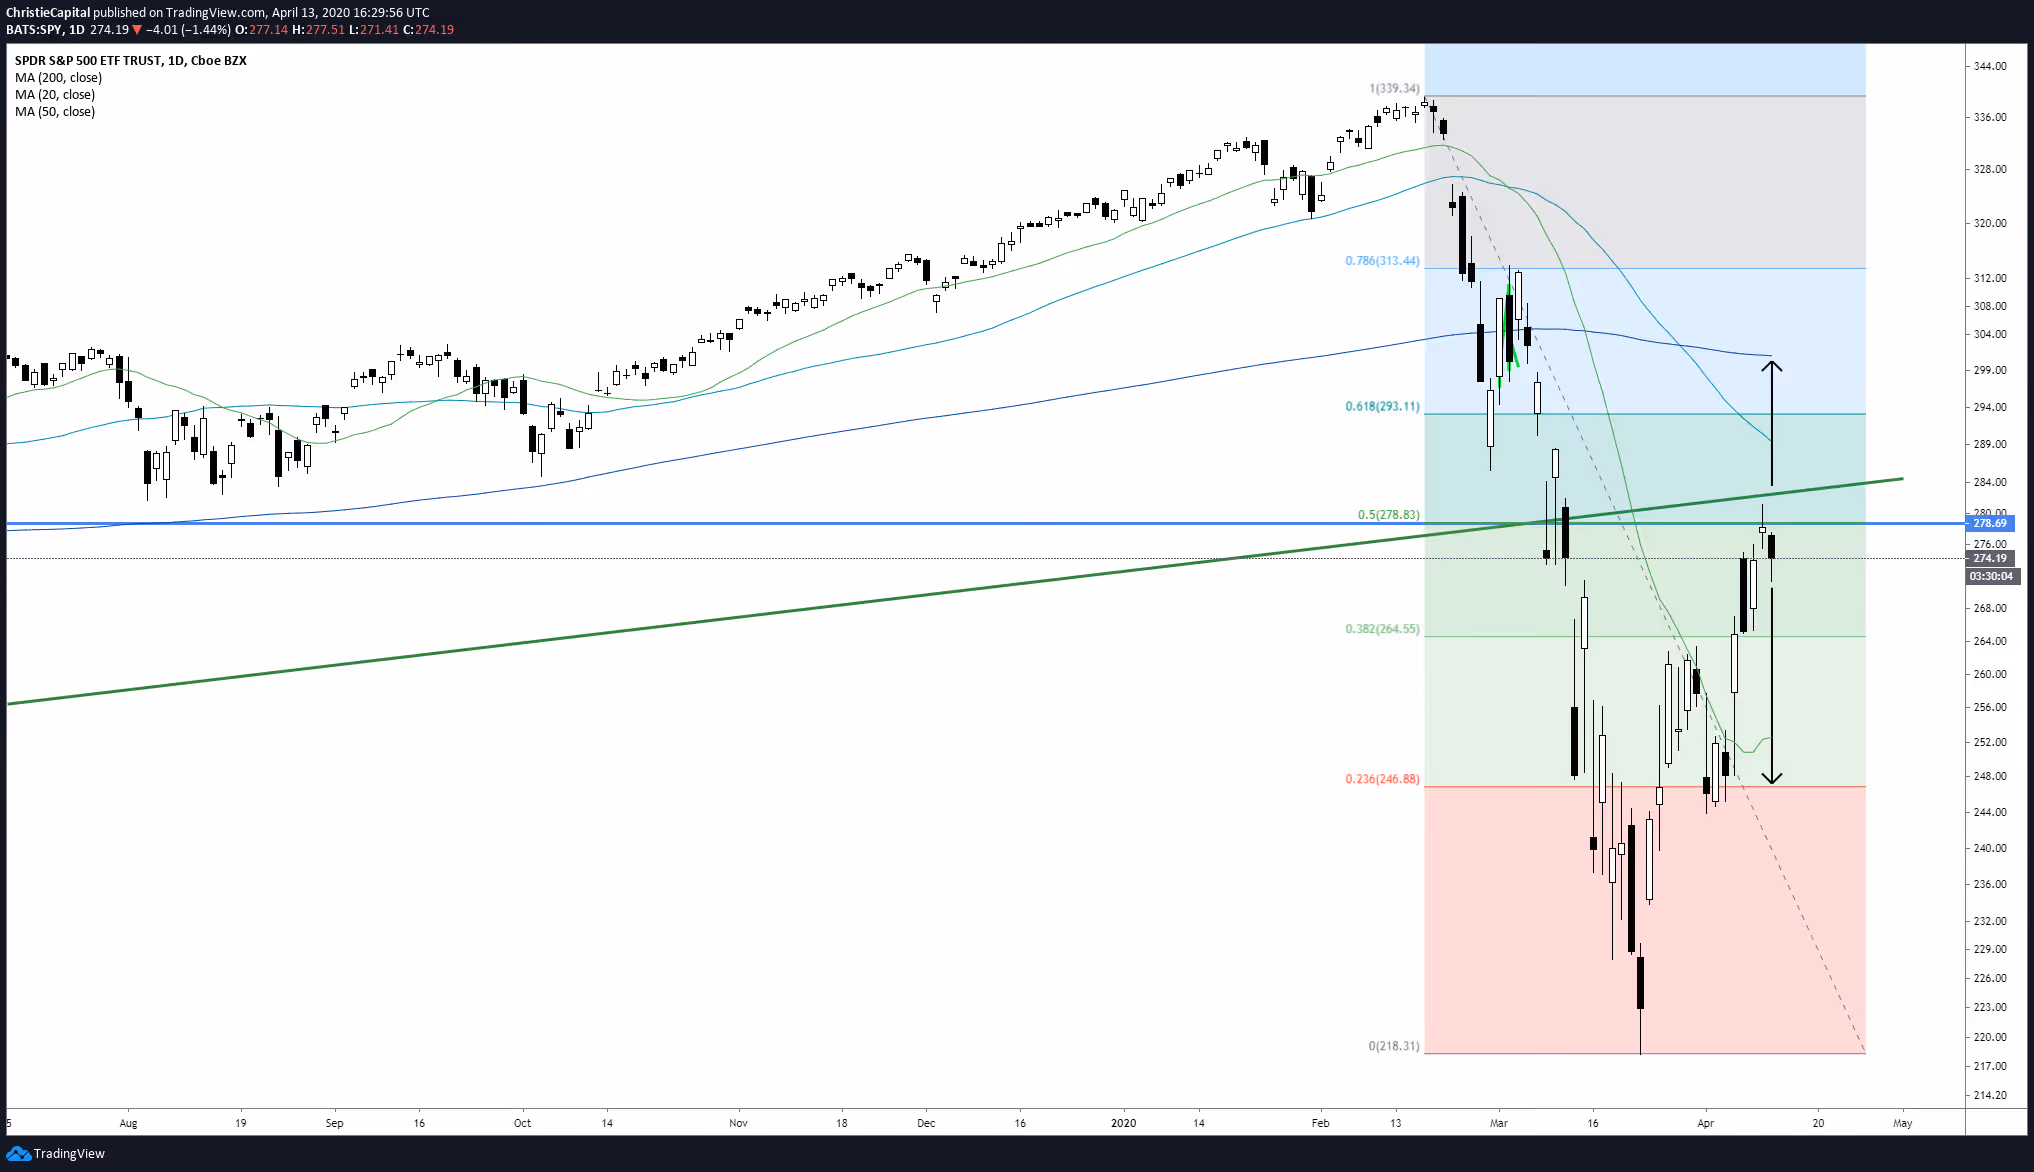
Let's focus in on a daily chart of SPY. The index has retraced 50% of its decline from record highs to March lows. Notice how we posted a spinning top reversal candlestick pattern just below the decade long rising trend line in green. Caution is warranted here. We need to see a strong breakout to the upside next week which would set us up for a bullish strategy towards the 50-day moving average at around the $300 level. A reversal next week would set the market up for a test of April lows near $246 and ultimately the March low at $218.50. Below, a picture speaks a thousand words.
What about Gold?
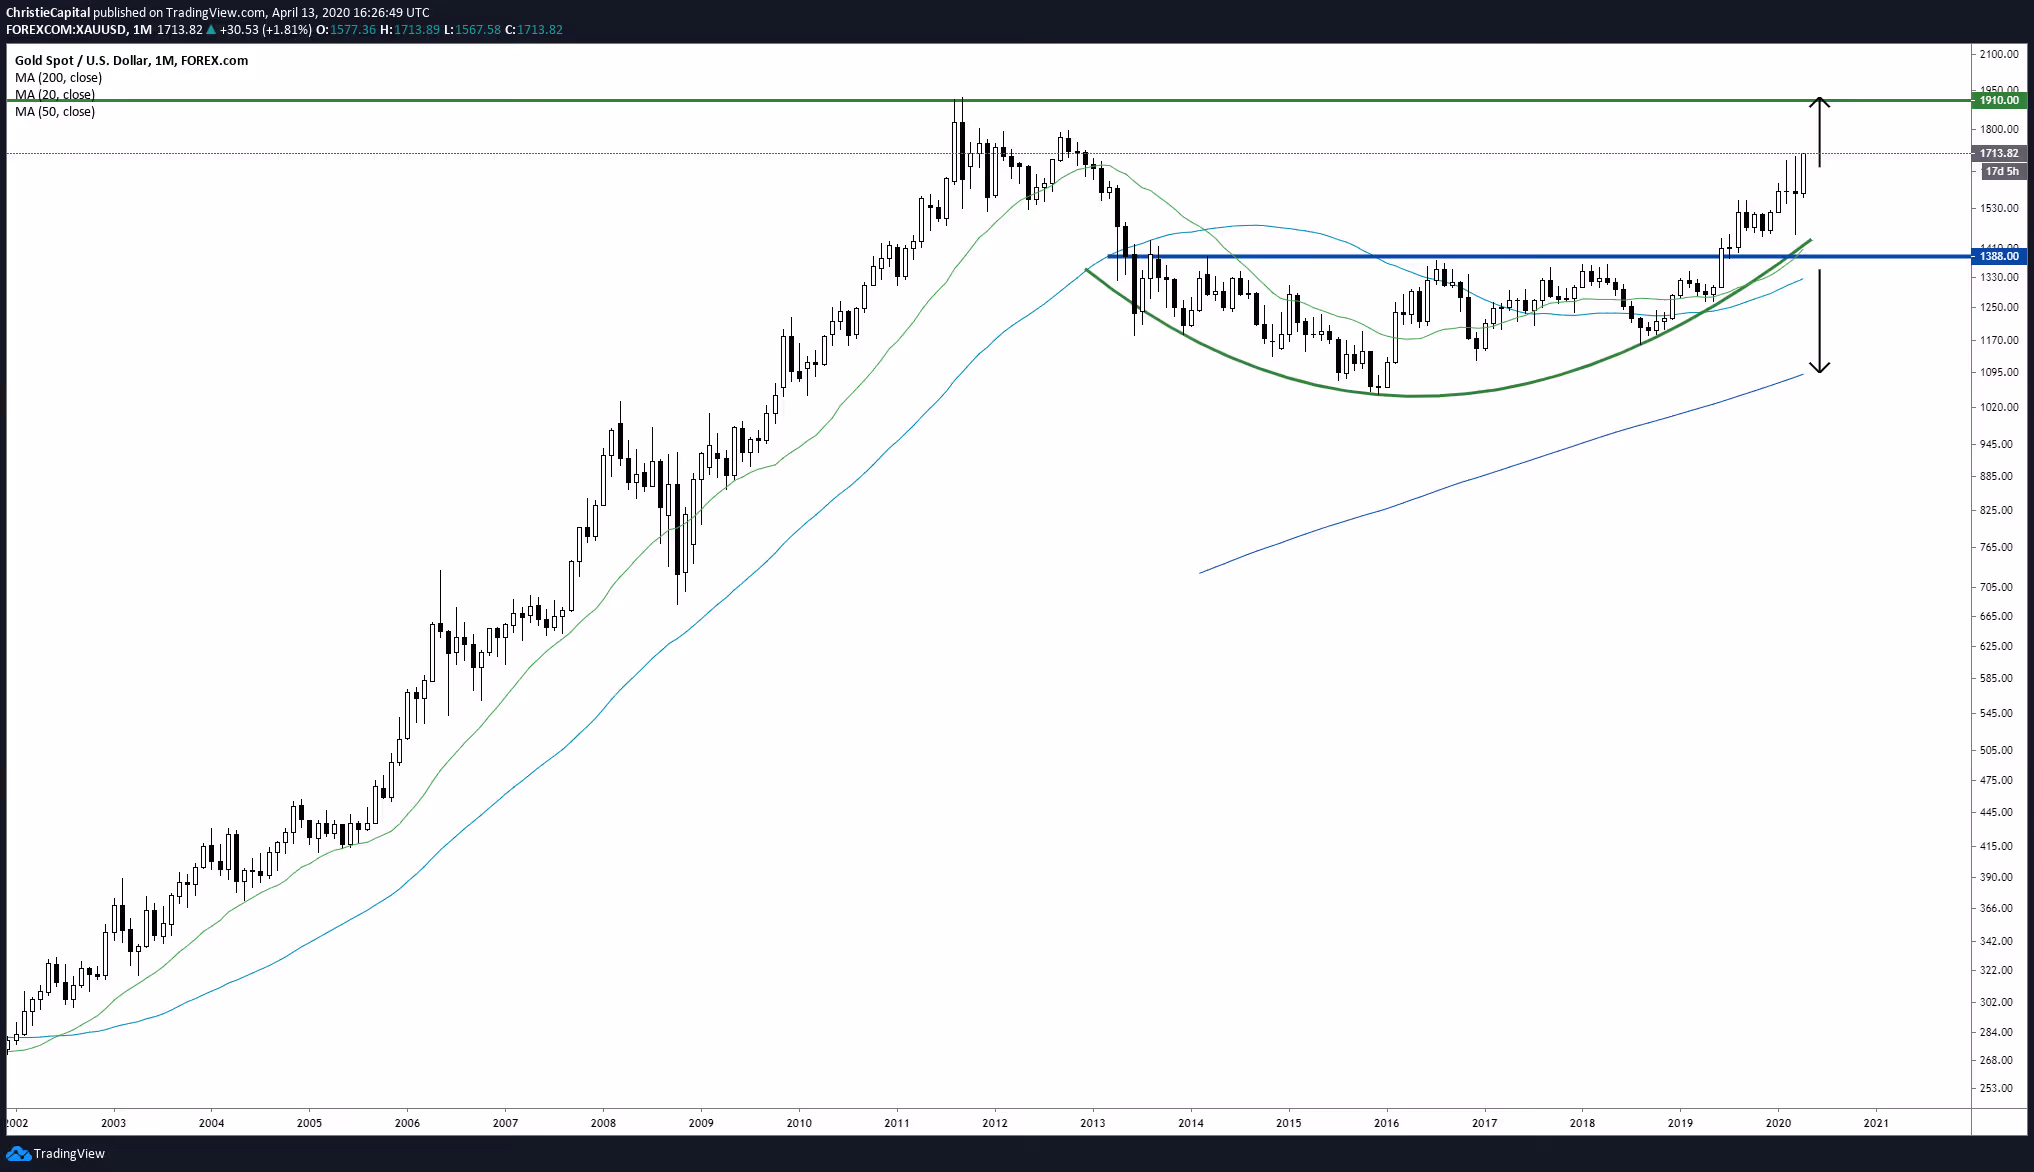
Worried about the Fed printing money like there is no tomorrow? No one has figured out how to print gold yet...Take a look at a monthly chart of spot gold. Prices have broken above a saucer (rounding bottom) consolidation just like they did back in 2004. A break above record highs at $1910 might signal the rebirth of a multi-year long up trend.
Want to Partner With Us?
Related Articles

Canadian dividend stocks that stand out when viewed through quantamental lens
.avif)
Value Focused Quant Strategy surfaces top Canadian stocks
