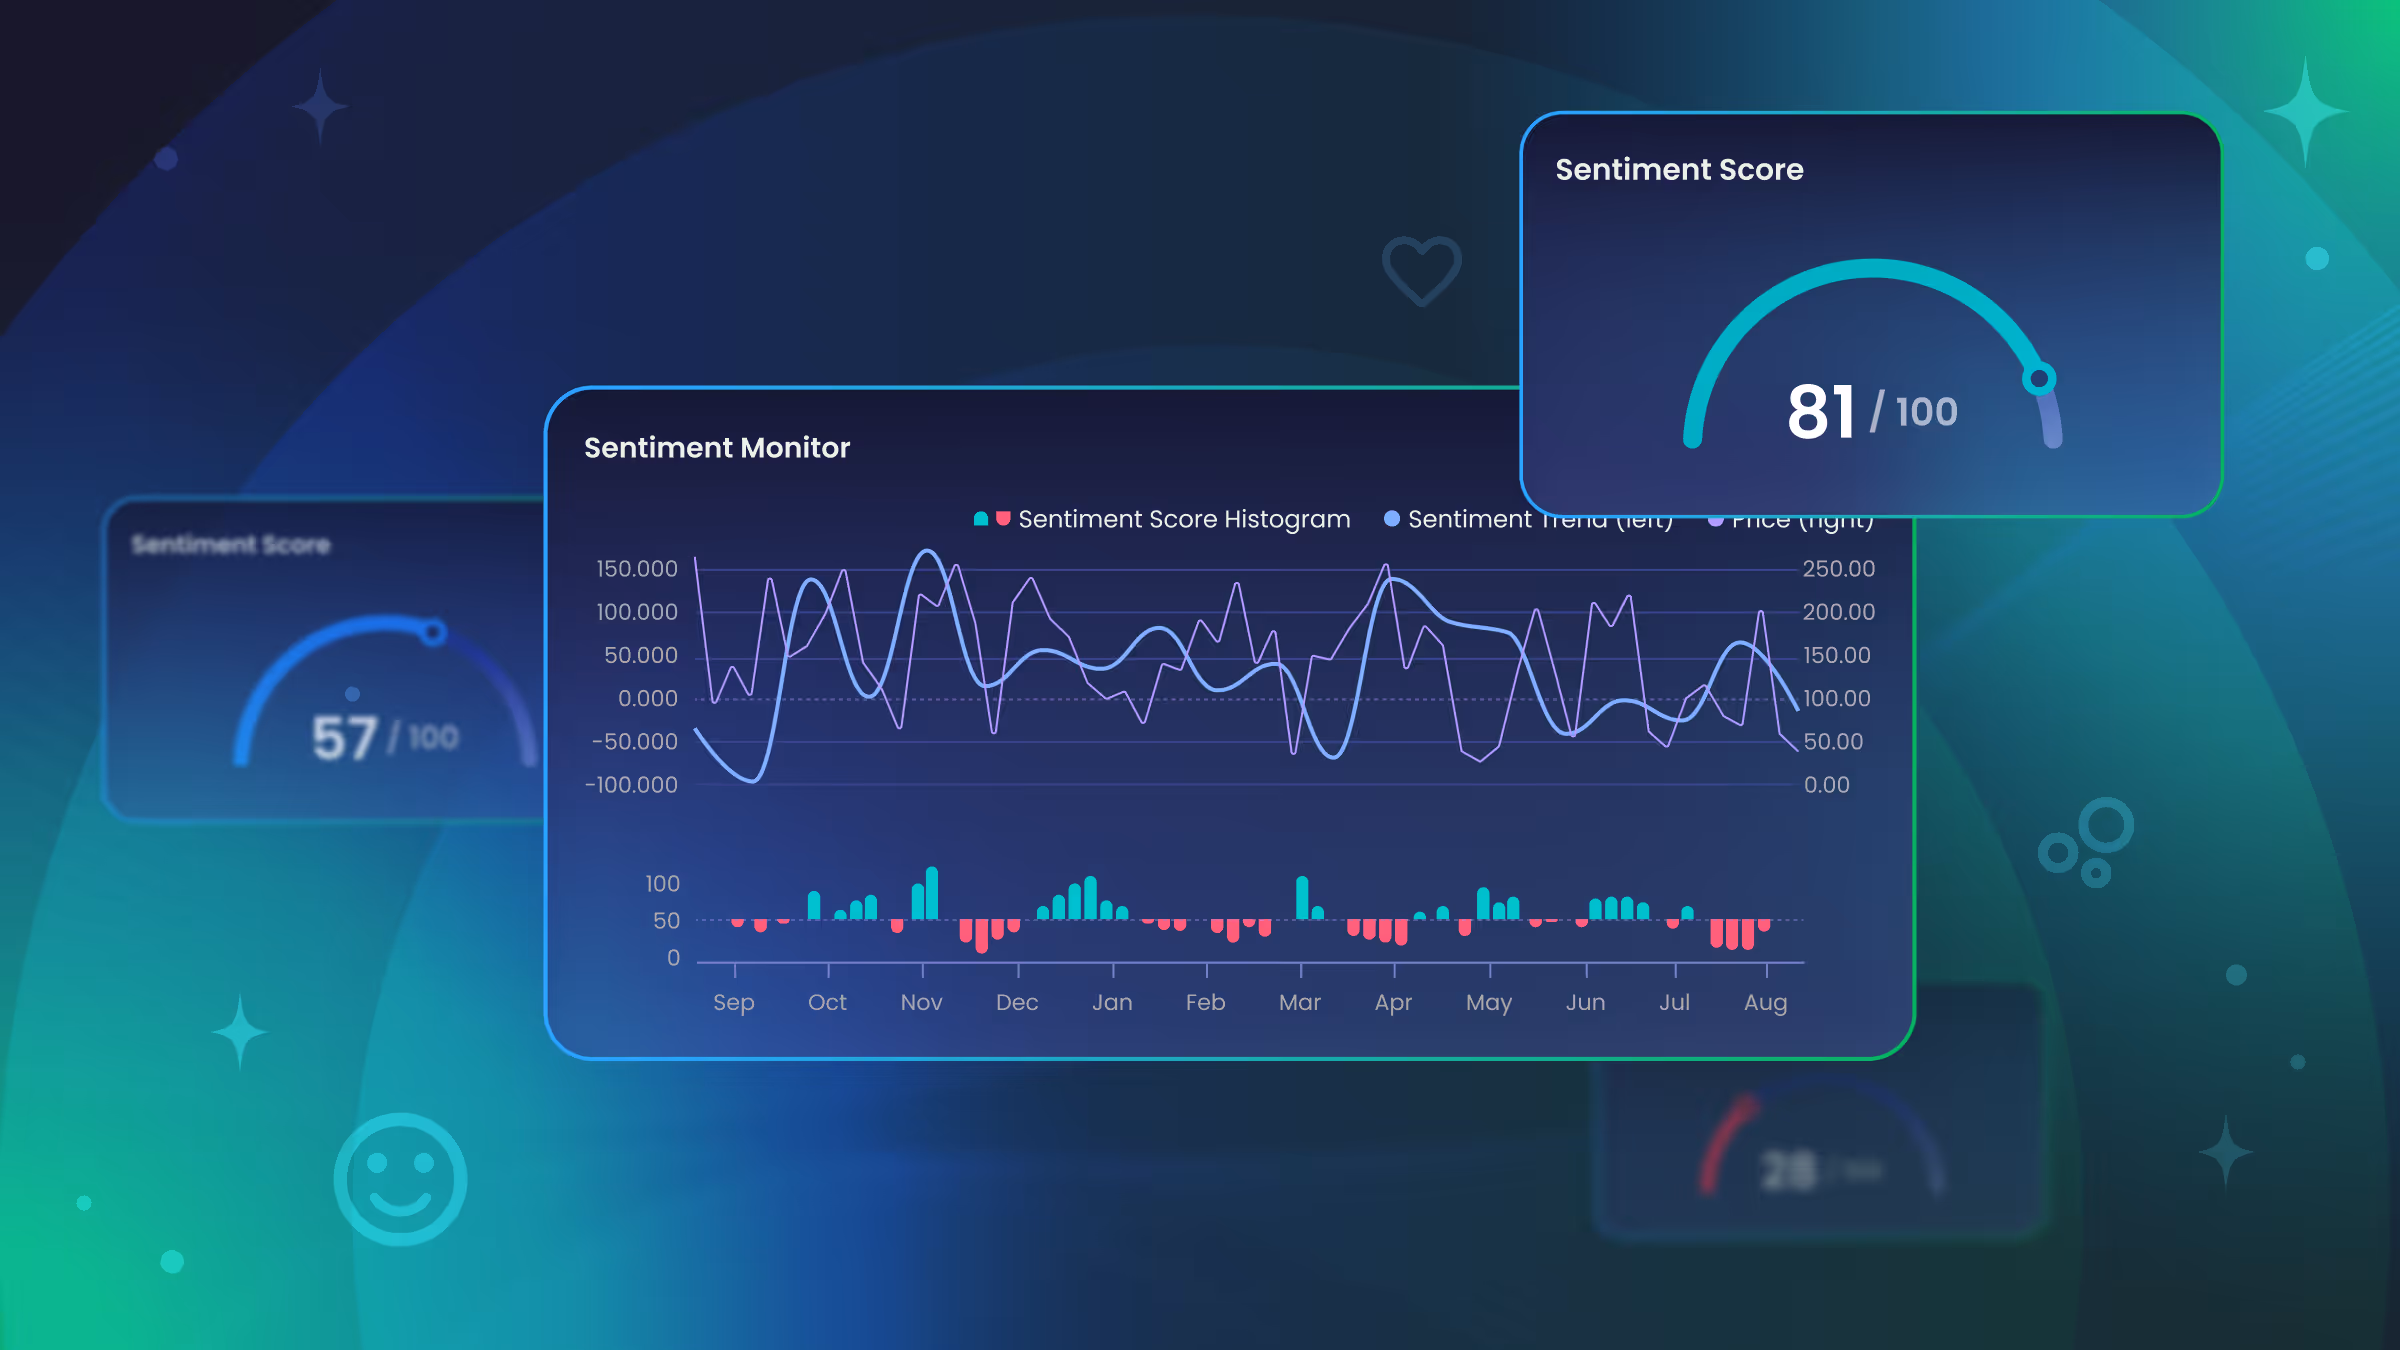
Stay Ahead of Market-Moving Sentiment Trends with Sentiment Monitor


This week, we released the Sentiment Monitor—a new, powerful feature in TC Crowd Insight® to help our users leverage public sentiments in their trading strategies.
How this intuitive tool helps investors make smarter decisions
Thanks to our proprietary NLP-AI Felix, which has been trained by senior analysts for 8 years, we continue to assign a positivity or a negativity score to each article we retrieve from over a thousand providers.
Using this score, we have built a formula that allows us to detect any convergence or divergence in sentiment horizons. The rationale is as follows:
- When sentiment between recent and older articles converges, investor psychology is broadly uniform. The market is aligned, and the price of the underlying asset is more likely to follow a sustained directional trend. This is a high-conviction regime for trend-following strategies.
- When sentiment between recent and older articles diverges, competing investor psychologies are clashing. The asset enters a period of contested narrative: at best, this produces a consolidation or pause; at worst, it signals an impending trend reversal.
We therefore expect our new sentiment line to be positively correlated with that of its underlying asset. Out of 505 underlying assets tested, our median correlation coefficient is 0.59.
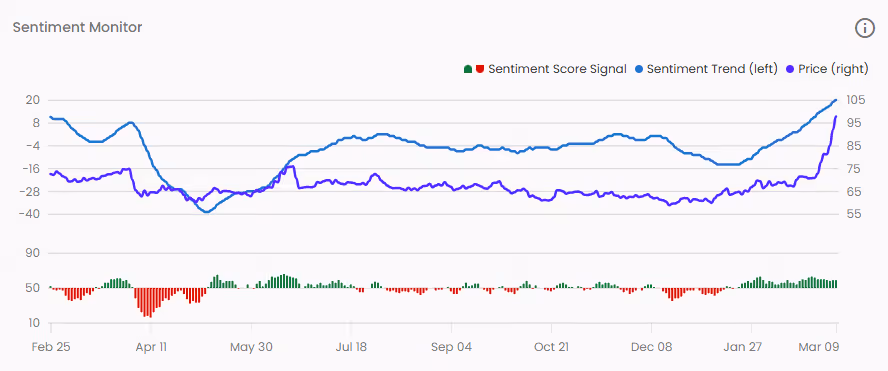
The overlay of the two curves may be sufficient by itself, but in order to be as actionable as possible, we have derived a histogram (capped between 0 & 100) to generate our signals.
- When our blue sentiment curve is rising, the histogram will be >50
- When our blue sentiment curve is decreasing, the histogram will be <50
Hence, exceeding the 50-point threshold triggers a buy signal, while falling below this threshold triggers a sell signal.
P.S: Please note that the position of the sentiment curve relative to the price of the underlying asset (above or below) – or any crossover between the two – is meaningless. It does not act as a price moving average.
Give your investors the power of Sentiment Research
Sentiment analysis has been proven to be a very effective investing strategy, outperforming traditional Buy & Hold approach.
With Trading Central’s award-winning, proprietary sentiment research—delivered in a modern, intuitive interface—investors gain a concise view into how the public feels towards an instrument without the information overload.
Book a demo!
Want to Partner With Us?
Related Articles
Stay Ahead of Market-Moving Sentiment Trends with Sentiment Monitor
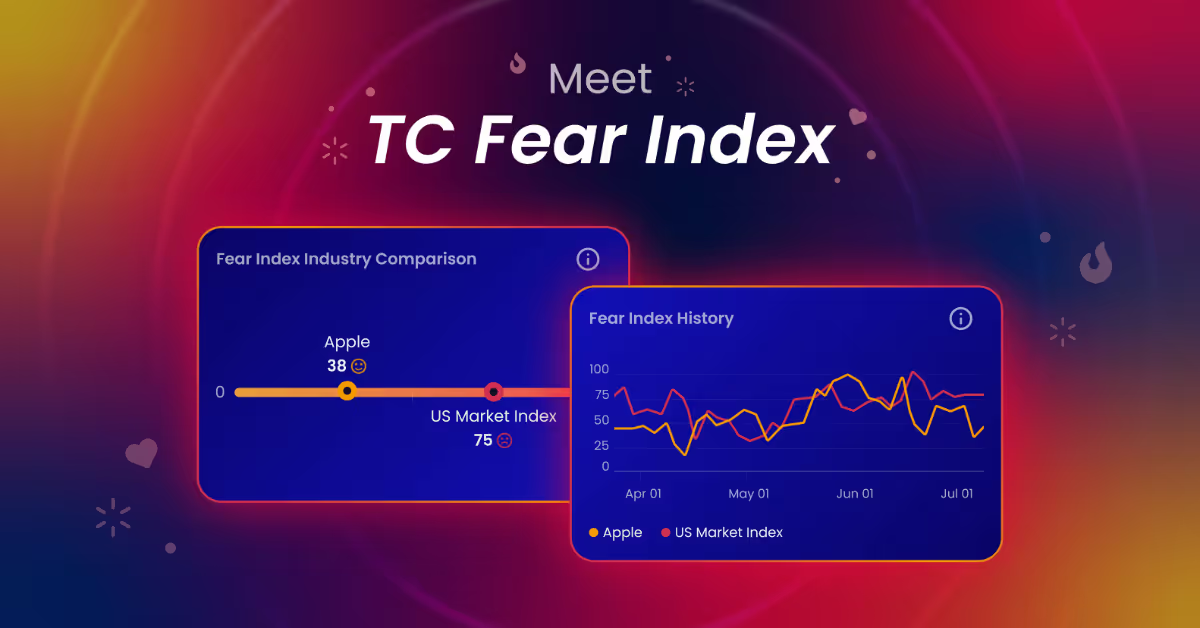
When Emotion Moves Markets: Keep Your Investors Ahead With TC Fear Index
