
Despite what some financial advisors or self-proclaimed market gurus may claim, no one can consistently predict where a stock—or the broader economy—is headed. While fortunes have been made by those selling the illusion of foresight, countless investors have lost money following advice that proved little more than modern fortune-telling.
To make informed decisions, investors must understand the three main forces that drive stock prices:
With tools like those from Trading Central (TC), both new and seasoned investors can strengthen their research and make more confident trading decisions. In this article, we’ll explain how to use TC’s tools to evaluate these three pillars—and we’ll wrap up with a case study on Nvidia (NVDA) to show how to put it all together.
Fundamental analysis examines a company’s financial health. That is, its revenues, profits, assets, liabilities, and cash flows. These indicators reflect how efficiently a business operates. For example, rising revenue and declining costs can signal improving margins, while growing earnings per share (EPS) may point to sustainable profitability.
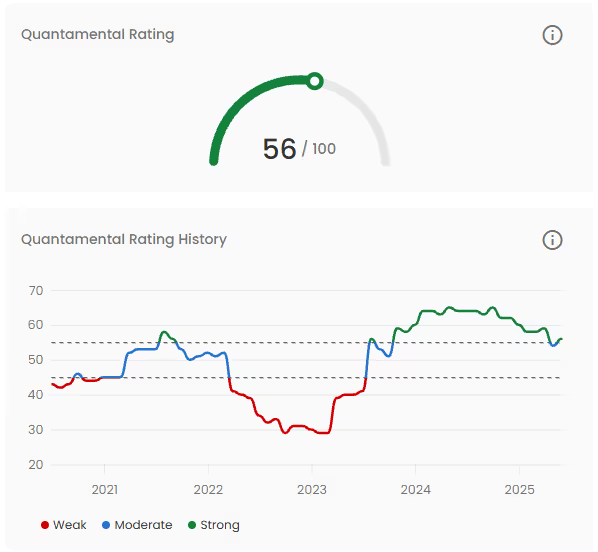
TC’s Fundamental Insight (FUN) simplifies the process of analyzing complex financial data. At its heart is the Quantamental Rating (QR), a 0–100 score combining five factors: Valuation, Growth, Quality, Momentum, and Income. A higher QR suggests a stronger position in its industry compared to its peers. FUN also provides access to a stock’s five-year QR history and a 12-month target price, helping investors track trends and set expectations.
However, strong looking fundamentals can sometimes be deceptive. Companies may use deferred revenue, one-time expenses, or aggressive accounting practices to present a rosier financial picture. That’s why it’s critical to examine not just the data itself but how it’s reported.
Bottom line: Tools like TC’s QR make it easier to screen and compare stocks, but careful analysis is still required. Stay alert for red flags and remember: solid fundamentals on paper don’t always tell the full story.
In today’s markets, where millions of retail investors have easy access to trading platforms, ignoring sentiment and technicals is a costly mistake. Incorporating sentiment into your process helps uncover trends early and refine your timing.
With information overload from news, social media, and blogs, TC's Market Buzz helps traders cut through the noise. It aggregates sentiment from over 100,000 online sources, tracks 600+ financial events, and covers 50,000+ instruments.
Market Buzz provides:
TC's Technical Insight complements Market Buzz by identifying technical patterns and price events across different timeframes—short, medium, and long term. It includes:
By combining these tools, traders can align what people say with what the charts show.
Stock prices don’t move in a vacuum. Economic indicators, whether its GDP growth and inflation to employment data and central bank decisions, directly influence company performance and investor behavior.
Though tailored for Forex, TC's Economic Insight helps investors across all asset classes monitor and react to real-time economic events across 38 countries. Features include:
Even if an event doesn’t mention a specific stock, understanding its effect on major indices and the broader economy allows investors to make logical inferences.
Housed within Fundamental Insight, TC's Nowcasting uses daily economic releases to determine where we are in the business cycle: Recovery, Expansion, Slowdown, or Recession. Each phase includes:
Understanding the theory and tools are one thing but putting it all into action is where the real value lies. In the case study ahead, we’ll break down Nvidia (NVDA) using Trading Central’s tools to show how these insights come together to guide smarter trading decisions.
To bring the concepts we've discussed to life, let’s apply them to a real-world example: Nvidia (NVDA), a leader in the semiconductor industry.
Nvidia currently has a Quantamental Rating (QR) of 56, suggesting solid fundamentals relative to peers in the semiconductor sector. Reviewing its QR trend, the company showed upward momentum from its 2023 lows, plateaued in 2024, and declined into 2025.
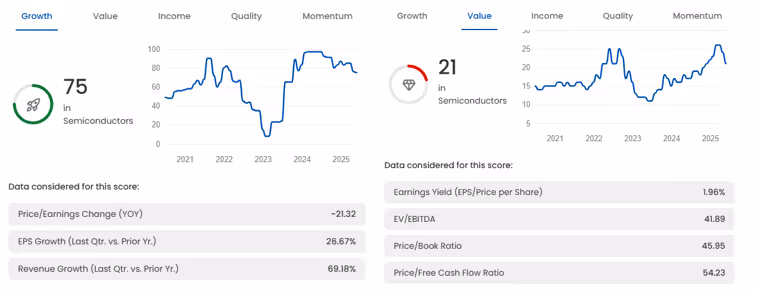
A closer look shows a Growth score of 75, highlighting robust EPS and revenue growth in the most recent quarter, while a Value score of 21, suggests that Nvidia’s valuation metrics (like P/E and P/B ratios) are relatively expensive versus its peers. Moreover, the stock has a price target for the next 12 months of $183, about a 7% gain compared to the last closing price.
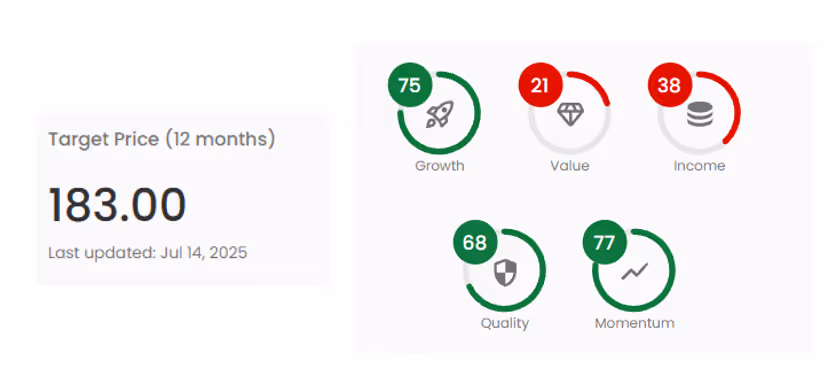
Fundamental Insight breaks down these five core categories so investors can pinpoint why a stock is scoring the way it is. For example, Nvidia’s impressive ROE of 115.46% stands out, while its low Value score is likely weighed down by its high price multiples.
From a macro lens, Nowcasting currently classifies the U.S. economy in a Recovery phase. While this environment tends to favor growth and tech stocks like Nvidia, it generally offers less support for large caps, like Nvidia, compared to mid or small caps.

Finally, in terms of peer comparison, Nvidia is not among the top five stocks in its sector according to QR rankings. Alternatives like KLA (KLAC) and Qualcomm (QCOM) may offer more attractive risk-reward profiles.

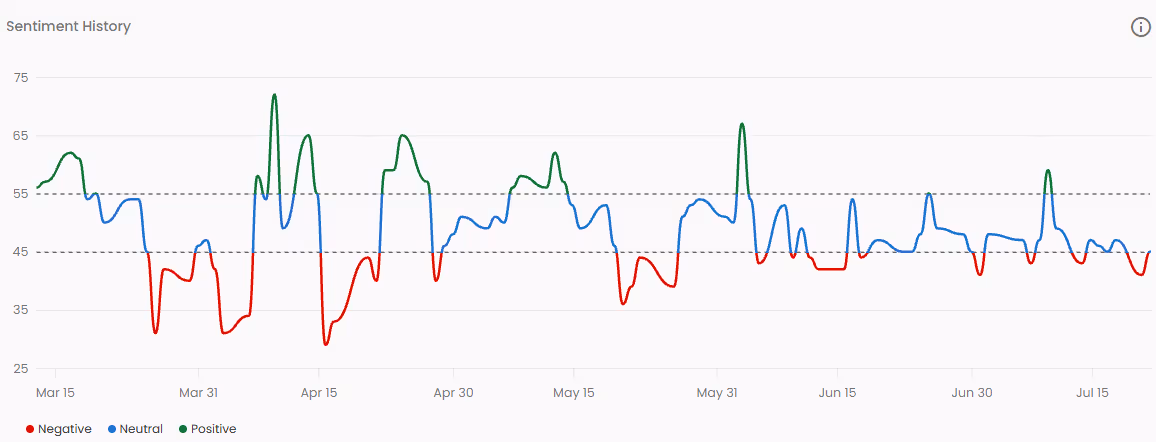
Moving to sentiment analysis, Nvidia’s current sentiment score is 45 out of 100, indicating a neutral stance from the market. Subjectivity remains low, suggesting that investor discussions are relatively rational and objective.

Looking at the sentiment history, Nvidia’s market sentiment has been trending lower after reaching 59 in early July and is well down from high’s seen in April, when it reached 72. Nevertheless, current sentiment is higher than the lows seen April fueled by worries on the tariffs being proposed by the Trump administration on all its trade partners. At that point, the sentiment score was at 29.
Some of Nvidia’s peers currently stand more favorable in investors’ eyes, including Micron Technology (MU), which also showed up as a better positioned peer in Fundamental Insight.
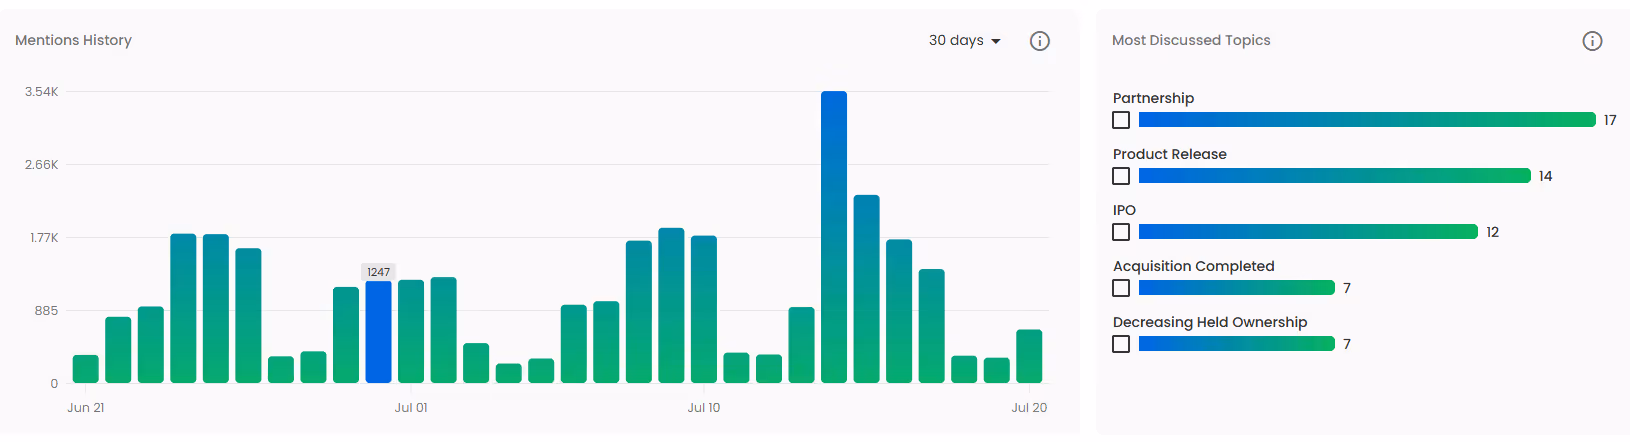
Overall mentions in the past 24 hours are above average, with 1231 mentions counted, mostly from social sources. Additionally, the tool provides us with a trend analysis, which conveys the key technical details of an asset, helping investors gain a clear understanding of a scenario.
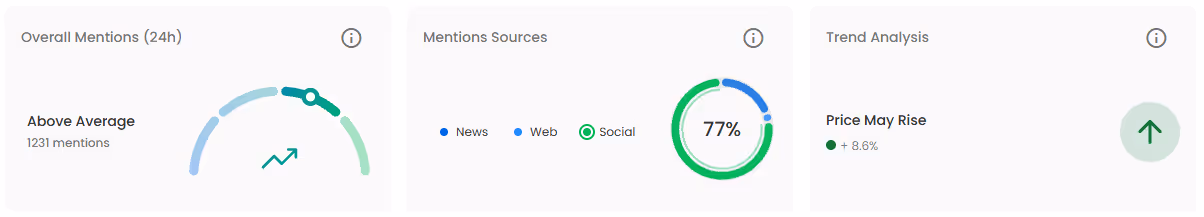
Mentions are overall at a low point if we look back the previous 30 days. Some of the most discussed topics for Nvidia are “Partnership” and “Product Release”.

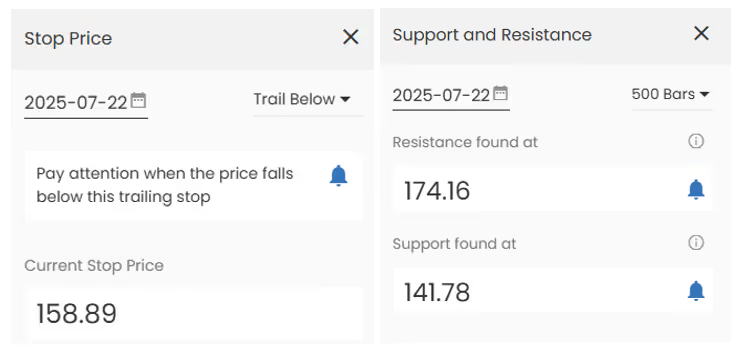
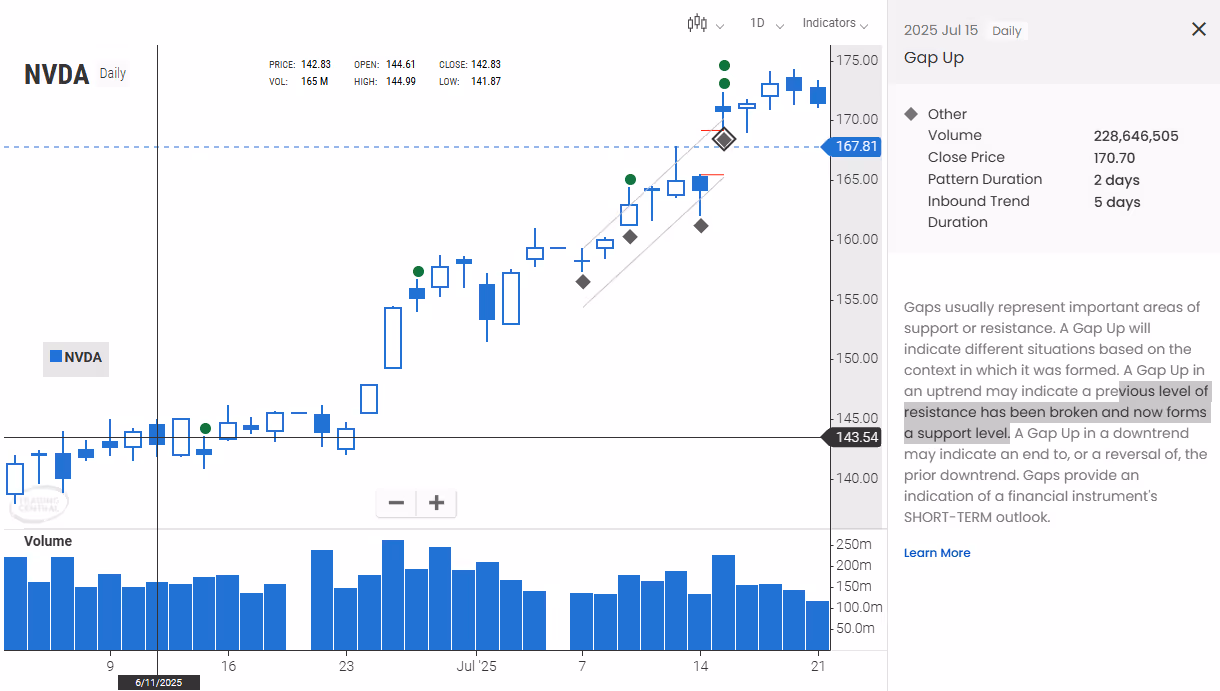
Nvidia’s technical outlook is bullish across all timeframes (short, intermediate, and long-term) with 26 active technical events and 6 anticipated events currently forming. According to TI, the most recent target on the stock is between 176 and 184 dollars per share, with key support found at 141.78 and key resistance at 174.16. A stop price for a long position entered on July 22, 2025 would be a 158.89., based on TC’s Medium Trailing Stop.


Trading Central’s Technical Insight allows users to filter events by timeframe and pattern type, making it easy to tailor analysis to your trading style. You can even set alerts on key price levels to stay proactive in your strategy.
Although Economic Insight doesn’t directly tie macro events to individual stocks, it helps investors assess potential ripple effects by tracking how major indices, like the Nasdaq-100, respond to economic data releases.
Recent Example: U.S. Inflation Reports

Nvidia, as a major component of the Nasdaq-100, mirrored this movement:
This case study illustrates how no single factor determines a stock’s price. Nvidia has strong fundamentals, mixed sentiment, and favorable technicals, but macroeconomic forces and broader sector trends continue to shape its performance.
Whether it's Fed rate decisions, earnings momentum, or online buzz, price action is the result of a dynamic interplay between all three forces: fundamentals, sentiment, and macroeconomics.
As John Maynard Keynes said, “The market can remain irrational longer than you can remain solvent.”
The key to staying on the right side of that equation? Preparedness and data-driven research. With Trading Central’s tools at your disposal, you're equipped to make smarter, more well-rounded investment decisions.
Happy Trading.


.png)
.png)
.png)